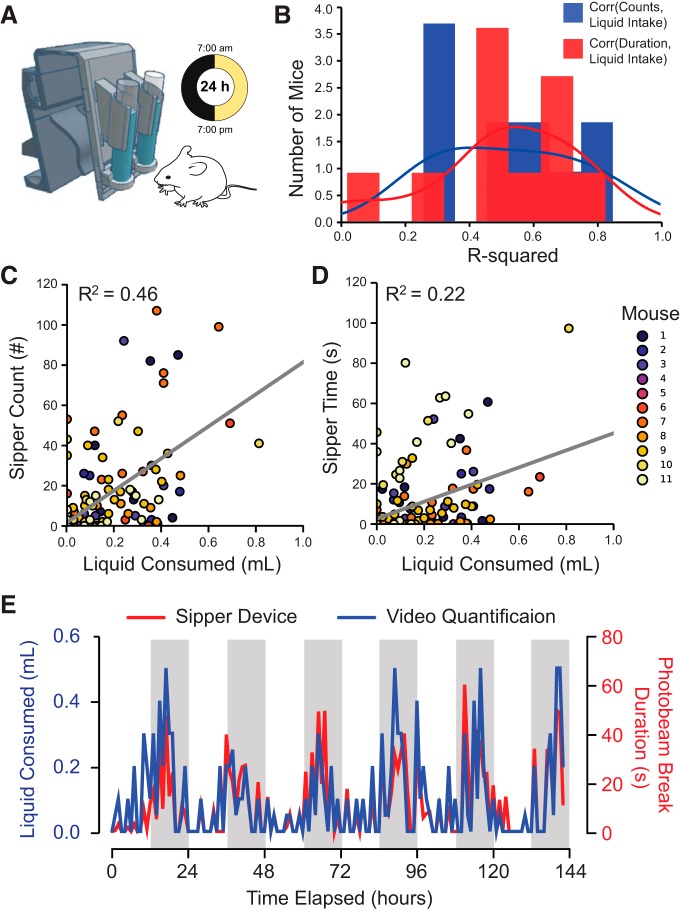
Figure 2.
Functional validation of liquid consumption with the home-cage drinking monitor. A, Schematic of the experimental setup. B, Histogram depicting the distribution of R 2 values of the correlation between measurements (counts or duration) registered on the individual sipper devices with the volume of liquid consumed from the same device, as measured via time-lapse video. C, D, Across all 11 mice tested, sipper counts and durations of interactions with the sipper device weakly correlated with the amount of water consumed by visual quantification with time-lapse video. E, Circadian rhythms in lick duration and volume of liquid consumed were evident over the 5 d of recording.

