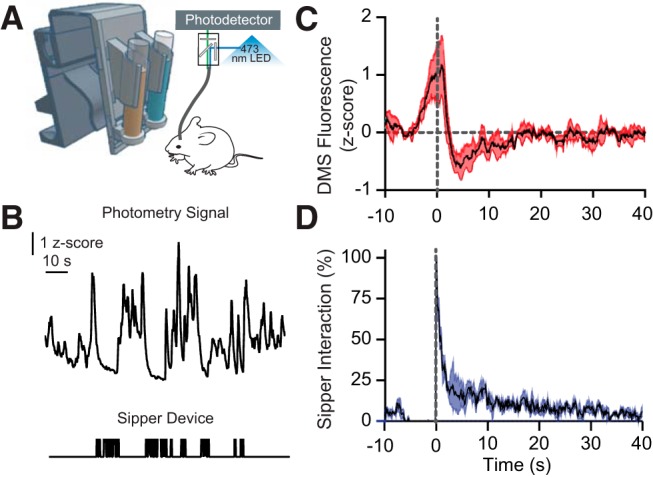
Figure 4.

Integration of the drinking monitor with in vivo fiber photometry. A, Schematic of the experiment; photo-interrupter beam breaks registered on digital Arduino pins triggered a TTL pulse to an in vivo fiber photometry system. B, Representative raw trace of gCamp signal recorded in the DMS (top) and concomitant sipper interaction bouts (bottom). C, Normalized gCamp traces were averaged across trials for all mice and were aligned to the onset of the lick bout. Black line, Mean; red, SEM. D, The duration of sipper interactions is aligned to the onset of the lick bout; the mean probability of a sipper interaction is indicated in black, and SEM is depicted in blue. Both C and D are aligned to the onset of lick bout.
