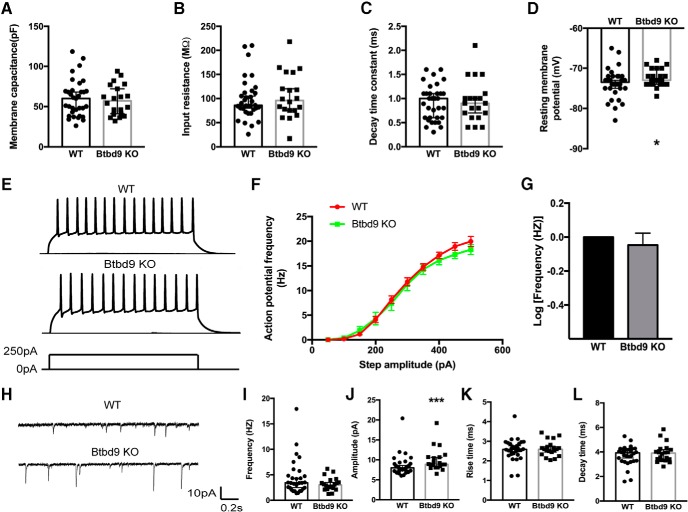
Figure 2.
Whole-cell patch-clamp recording of MSNs from the systematic Btbd9 KO mice and their WT littermates. A–C, Btbd9 KO MSNs (n = 20) did not have changes in membrane capacitance, input resistance and decay time constant compared with the WT MSNs (n = 33). D, Btbd9 KO MSNs (n = 22) had increased resting membrane potential compared with the WTs (n = 34). E, Representative responses to the injected currents at 250 pA of KO (n = 21) and WT (n = 34) MSNs. F, The frequency-current relationship for WT and Btbd9 KO MSNs. G, The response of KO MSNs to the injected currents was not significantly different from the WT MSNs. H, Representative sEPSC traces of KO (n = 20) and WT (n = 30) MSNs. I, The frequency of spontaneous firing was similar between the two groups. J, Btbd9 KO MSNs had a higher amplitude of sEPSC than the WT. K, L, Both the rise and decay time were not different between Btbd9 homozygous KO and WT MSNs. GEE model normalized the WT group in the bar graph of B to 0 without the error bars. Data in A–D, I–L were presented as median with 95% confidence intervals (CIs); ***p < 0.005, *p < 0.05.

