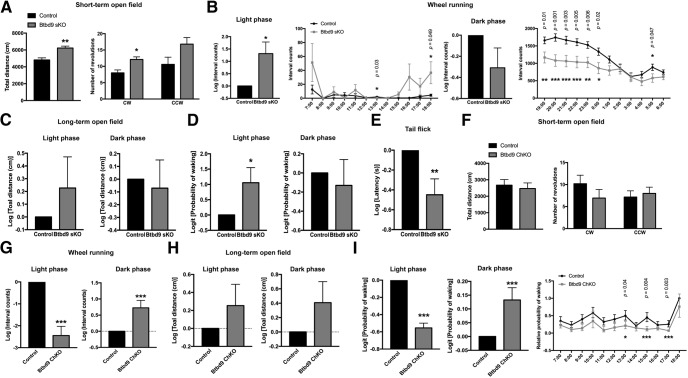
Figure 5.
Behavior studies of the conditional KO mice. A, Btbd9 sKO mice traveled more and showed an increase in CW circling in the 30-min open field test. B, Btbd9 sKO mice had increased activity in the wheel running test compared with the controls during the light phase, but not in the dark phase. Detailed hourly differences are listed (see Materials and Methods). Significant p values are marked above the corresponding time points. C, In the long-term open field test, Btbd9 sKO mice did not show a significant change in the total distance traveled during both the light and the dark phases. D, Btbd9 sKO showed an increased probability of waking in the light phase of the long-term open field test. E, Btbd9 sKO mice showed shorter latencies to respond to a warm stimulus in the tail flick test. F, Btbd9 ChKO mice did not show activity alteration in the 30-min open field test. G, Btbd9 ChKO mice ran less during the light phase but ran more during the dark phase in the wheel running test. H, In the long-term open field test, Btbd9 ChKO mice did not have a significant change in the total distance traveled during both the light and the dark phases. I, The probability of waking significantly decreased during the light phase and significantly increased during the dark phase for the Btbd9 ChKO mice. Detailed hourly differences are listed (see Materials and Methods). Significant p values are marked above the corresponding time points. GEE model normalized the WT or control group in the bar graphs of B–E, G–I to 0 without error bars. Bars represent means plus SEs; ***p < 0.005, **p < 0.01, *p < 0.05.

