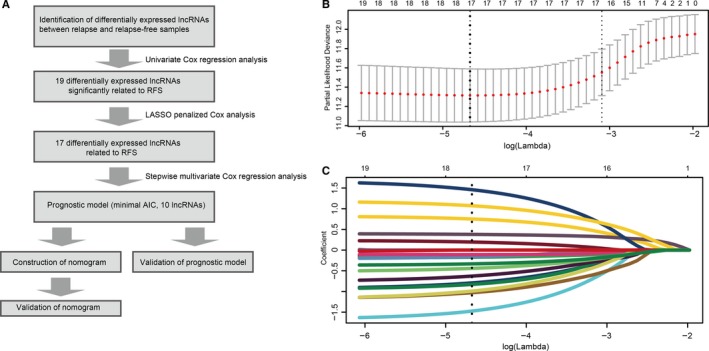
Figure 1.

Flow chart and 10‐time cross‐validation for tuning parameter selection. A, Flow chart indicating the process used to select target genes included in the analysis. B, Ten‐time cross‐validation for tuning parameter selection in the lasso model. C, LASSO coefficient profiles of the 19 prognostic lncRNAs. A vertical line is drawn at the value chosen by 10‐fold cross‐validation
