
Figure 6.
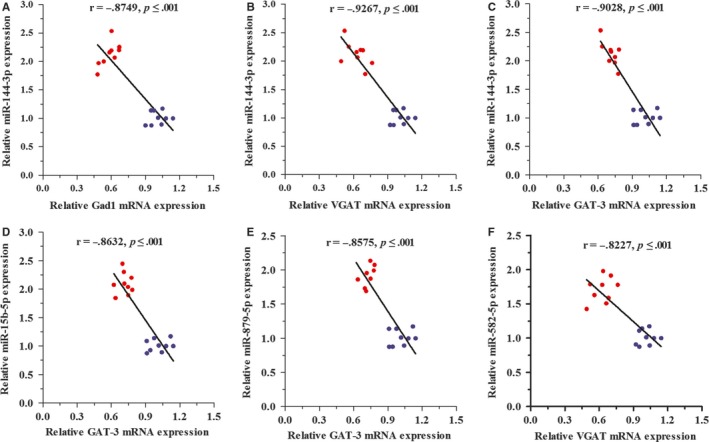
Correlation between miRNAs and their target mRNAs expression in the NAc tissue. The relationships between miRNAs and its corresponding target prediction were assessed by Pearson's correlation coefficients. A, shows the correlation between Gad1 mRNA and miR‐144‐3p expression (r = −.8749; P < .001). B, shows the correlation between VGAT mRNA and miR‐144‐3p (r = −.9267; P < .001). C, shows the correlation between GAT‐3 mRNA and miR‐144‐3p (r = −.9028; P < .001). D, shows the correlation between GAT‐3 mRNA and miR‐15b‐5p (r = −.8632; P < .001). E, shows the correlation between GAT‐3 mRNA and miR‐879‐5p (r = −.8575; P < .001). F, shows the correlation between VGAT mRNA and miR‐582‐5p (r = −.8227; P < .001). The data of qRT‐PCR of miRNAs and mRNAs were analysed in 10‐14 per group. Blue dots indicate congregation of the control group, and red dots indicate congregation of the depression group