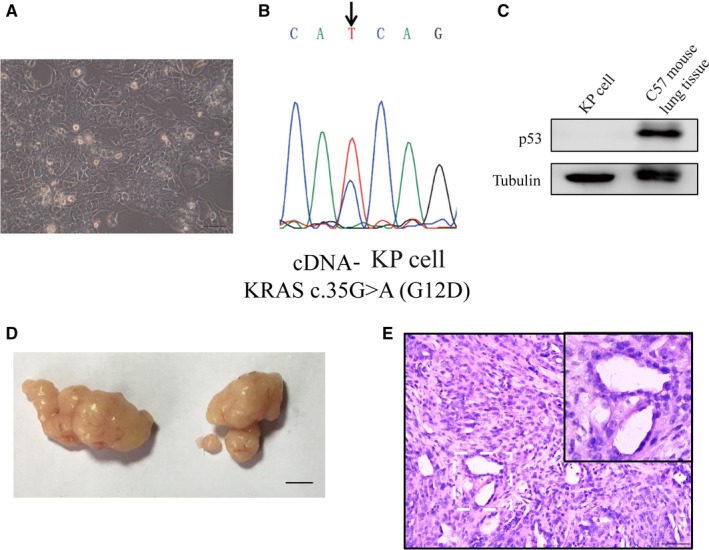
Figure 2.

Isolation and identification of KP cells. A, Micrograph of KP cells. Scale bars, 0.1mm. B, The DNA sequencing of the products of Kras gene cDNA RT‐PCR showed that Kras G12D expressed in the isolated KP cells. C, P53 was deleted in the KP cells. Western blot analysis was conducted in the KP cells and the normal lung tissue from LSL‐KrasG12D; p53flox/flox C57 mouse was used as positive control. D, Representative images of tumour at 4 weeks after subcutaneous injection of KP cells in C57 mice. Scale bars, 5mm. E, These formed tumours were confirmed by Haematoxylin and eosin (H&E) staining. Scale bars, 0.1 mm
