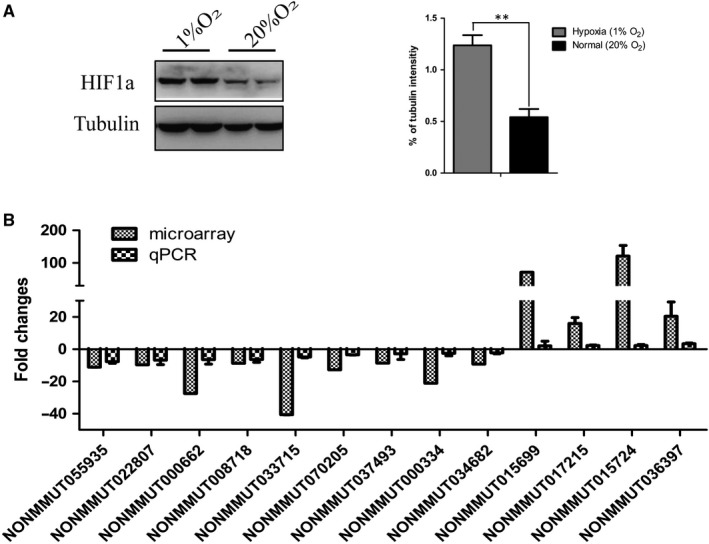
Figure 5.

Identification of hypoxia‐related lncRNAs in KP cells. A, KP cells were incubated under hypoxia with 1% O2 and normoxia (20% O2). Immunoblot (left) was used to detect HIF1α protein levels and was quantified by measuring the grey value of the bands. Data are shown as means ± SD. All P values are from two‐sided t tests. B, Comparison between microarray data and qPCR results of lncRNAs associated with hypoxia. The qPCR result validated the 13 out of 210 selected lnRNAs were regulated by hypoxia, whose expression exhibited same expression alteration direction to that in the microarray of the mouse lung adenocarcinoma tissues. The heights of the columns in the chart represent the log‐transformed median fold changes (tumour sample/normal tissues in microarray data of the mouse lung adenocarcinoma tissues or KP cells cultured in hypoxia/KP cells cultured in normoxia in qPCR results) in expression across the three lung adenocarcinoma tissues and KP cells cultured in hypoxia. Mean ± SD are shown, n = 3 or 2
