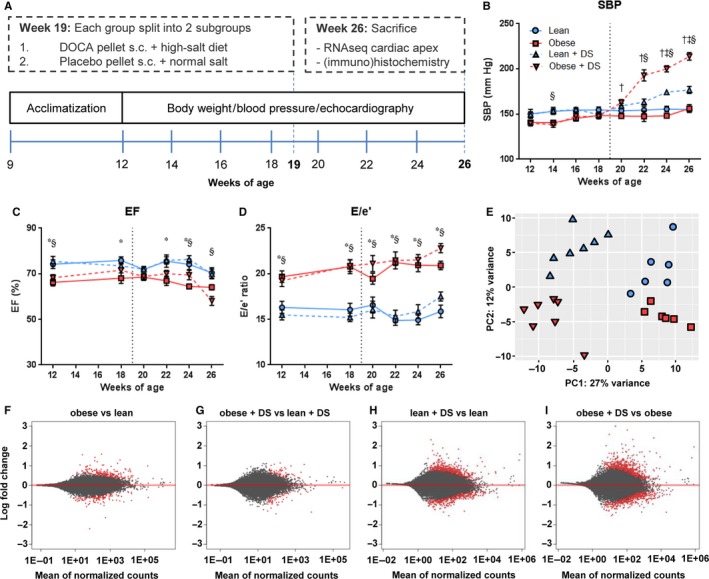
Figure 1.

Workflow and model characteristics. (A) Graphical workflow, showing that male lean and obese ZSF1 rats were studied from 12 to 26 weeks of age. Both lean and obese rats were treated with DS or placebo from 19 to 26 weeks of age to trigger severe hypertension. Echocardiographic, metabolic and hemodynamic analyses were done every 2 weeks, till sacrifice at the age of 26 weeks. Longitudinal plots of (B) systolic blood pressure (mm Hg), (C) ejection fraction (%) and (D) E/e’ ratio. n = 6‐7, * obese vs lean, § obese + DS vs lean + DS, ‡ lean + DS vs lean, † obese + DS vs obese P < .05. (E) Principal component analysis of expression profiles in cardiac tissue. Symbols denoting subgroups panels B‐E are shown in panel B. (F‐I) Graphic display of differential gene expression in which log2FC is plotted against the mean of normalized counts. Red dots represent the differentially expressed genes (FDR < 0.1), grey dots represent non‐differentially expressed genes
