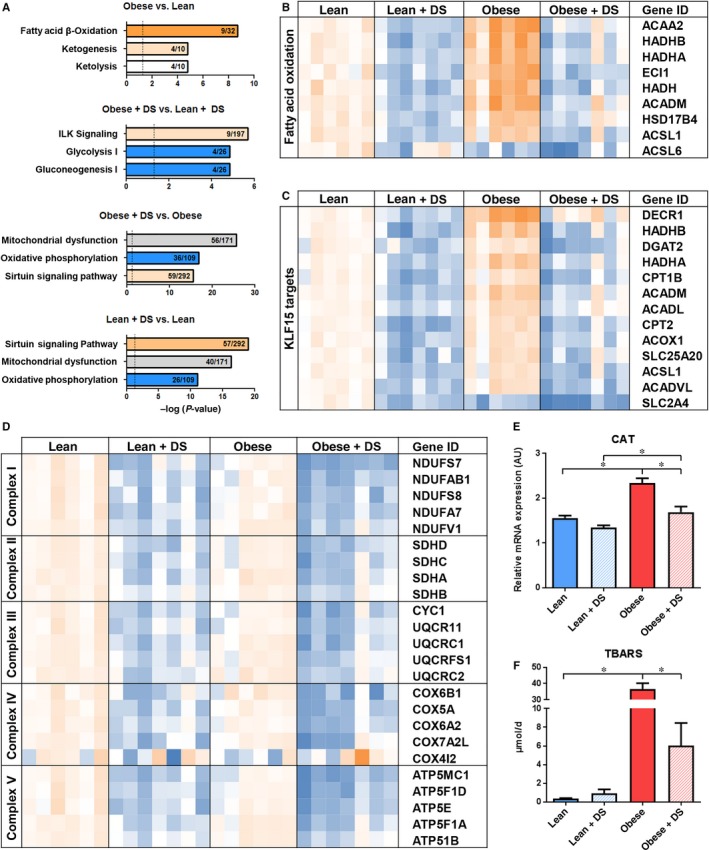
Figure 2.

Pathway analysis and mitochondrial gene expression (A) Graphical visualization of 3 most affected pathways according to Ingenuity Pathway Analysis (orange and blue represent pathway activation and repression, respectively, grey represents no direction available). (B) Schematic presentation of RNAseq data for differentially expressed genes involved in fatty acid oxidation, (C) KLF15‐induced transcription (D) and oxidative phosphorylation. Shown is a colour‐based representation of the reads per kilobase million, relative to the average expression in the lean group, for each individual rat (orange and blue represent increased and decreased expression, relatively). (E) QPCR analysis of oxidative stress marker CAT. n = 5‐7, * P < .05. (F) Analysis of urinary TBARS excretion as marker of systemic oxidative stress. n = 6‐7, * P < .05
