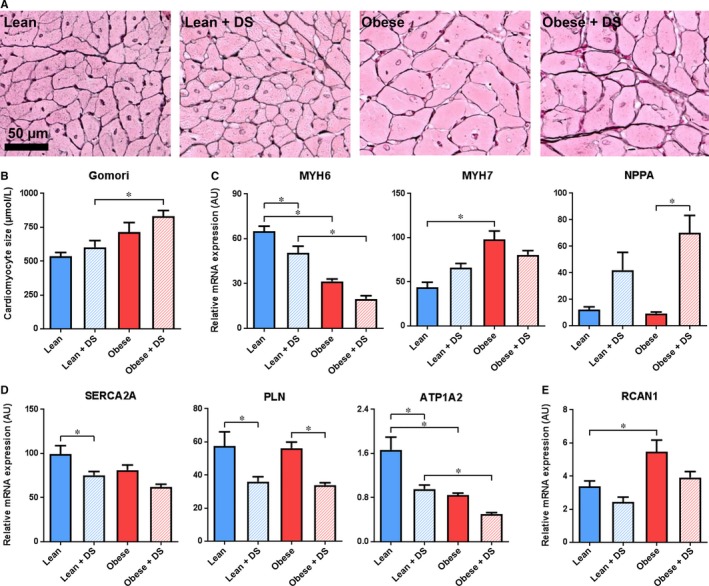
Figure 3.

Cardiomyocyte hypertrophy and foetal gene expression (A) Typical examples and (B) quantification of histological staining for cardiac hypertrophy (Gomori). n = 4‐6, * P < .05. C, QPCR analysis of cardiac transcription of hypertrophy markers MYH6, MYH7 and NPPA, (D) regulators of cytoplasmic Ca2+ levels SERCA2A, PLN and ATP1A2 and (E) transcriptional target of Ca2+‐induced NFAT activation RCAN1. n = 5‐7, * P < .05
