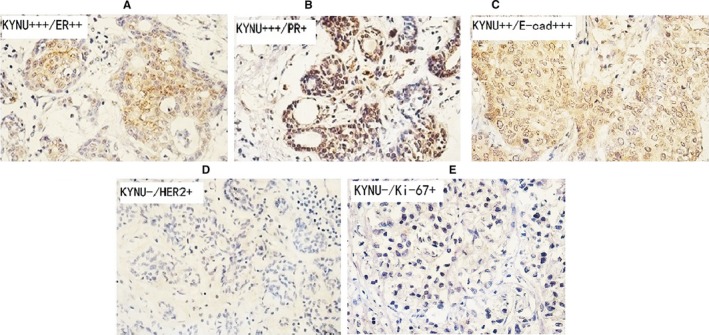
Figure 3.

The association of KYNU expression with the biomarkers of BC. A‐C, The IHC staining of high (++ to +++) KYNU in primary BC tissues of ER++ (A), PR+ (B) and E‐cad+++ (C) expressions. D‐E, The IHC staining of low (−) KYNU in primary BC tissues of HER2+ (D), Ki‐67+ (E) expressions. Microscopic image was at 400× magnitude
