
Figure 4.
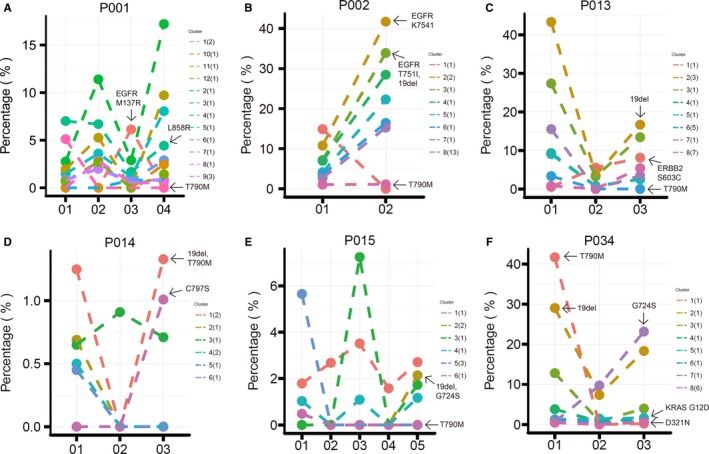
Clonality analysis at efficacy assessment time‐points. Clusters are indicated in different colours, and the mutation numbers included in each cluster are presented in brackets. For each patient, cluster 1 refers to the clonal cluster, the corresponding mutations are trunk mutations; other clusters and mutations are subclonal and branch mutations. The fraction changes of sensitive EGFR mutations, T790M and potential resistant mutations are marked by arrows