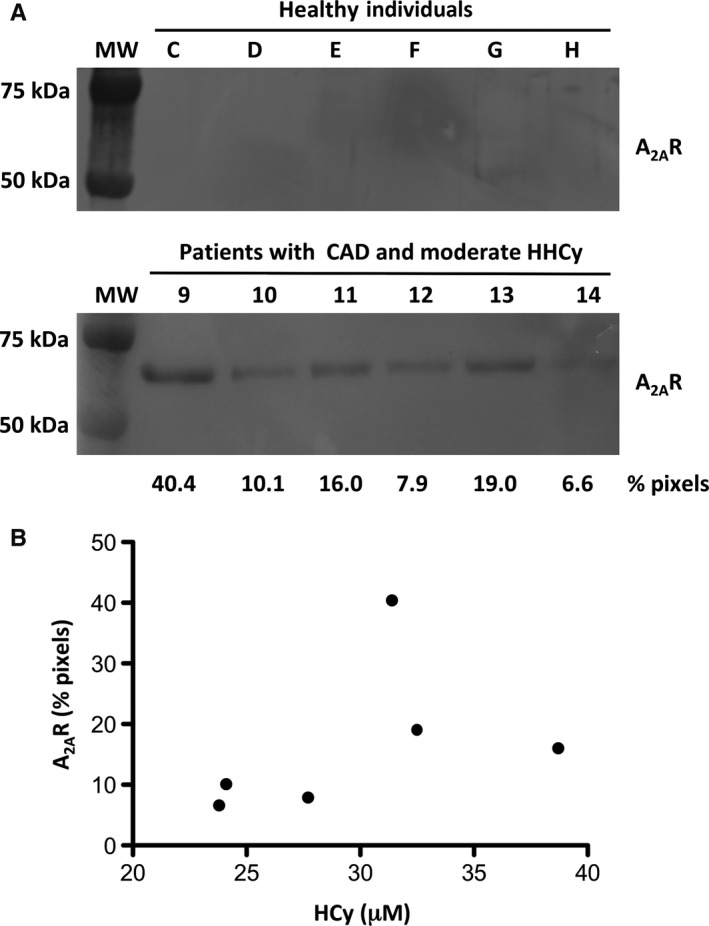
Figure 3.

Relationship between A2AR export in EV and hyperhomocysteinemia (HHCy). Western blots of EV from six healthy individuals (upper) and six CAD patients with moderate hyperhomocysteinemia (lower). Blots were revealed using anti‐A2AR primary antibody. Molecular weight markers are on the left. Blots are representative of triplicates. Blotted bands were quantified and results are given in % of total pixels (A). Scatter plot to display the correspondence of A2AR levels in EV of CAD patients (% pixels) with their HCy levels (µmol/L) given in Table 1. Each point represents a patient (B)
