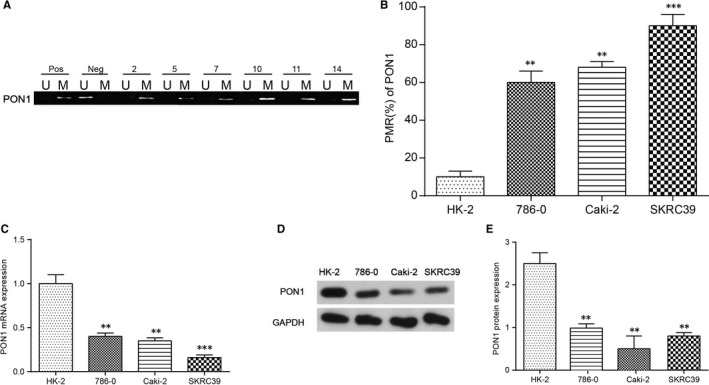
Figure 3.

PON1 was hypermethylated in renal tumour cells. A, PON1 was hypermethylated in tumour tissues using methylation‐specific PCR. ‘Pos’ represented positive control; ‘Neg’ represented negative control. M: methylated; U: unmethylated. B, PON1 was confirmed to be hypermethylated in 786‐O, Caki‐2, and SKRC39 cell lines compared with HK‐2cells. The change of DNA methylation level was maximal in SKRC39 cell line. ** P < 0.01, *** P < 0.001, compared with the HK‐2 cell lines. C, The mRNA levels of PON1 in tumour cells and normal cells were analysed by real‐time PCR. ** P < 0.01, *** P < 0.001, compared with the HK‐2 cell lines. Each data represented mean value ± standard deviation (SD). D‐E, The protein levels of PON1 in tumour cells and normal cells were determined using Western blotting. ** P < 0.01, compared with the HK‐2 cell lines
