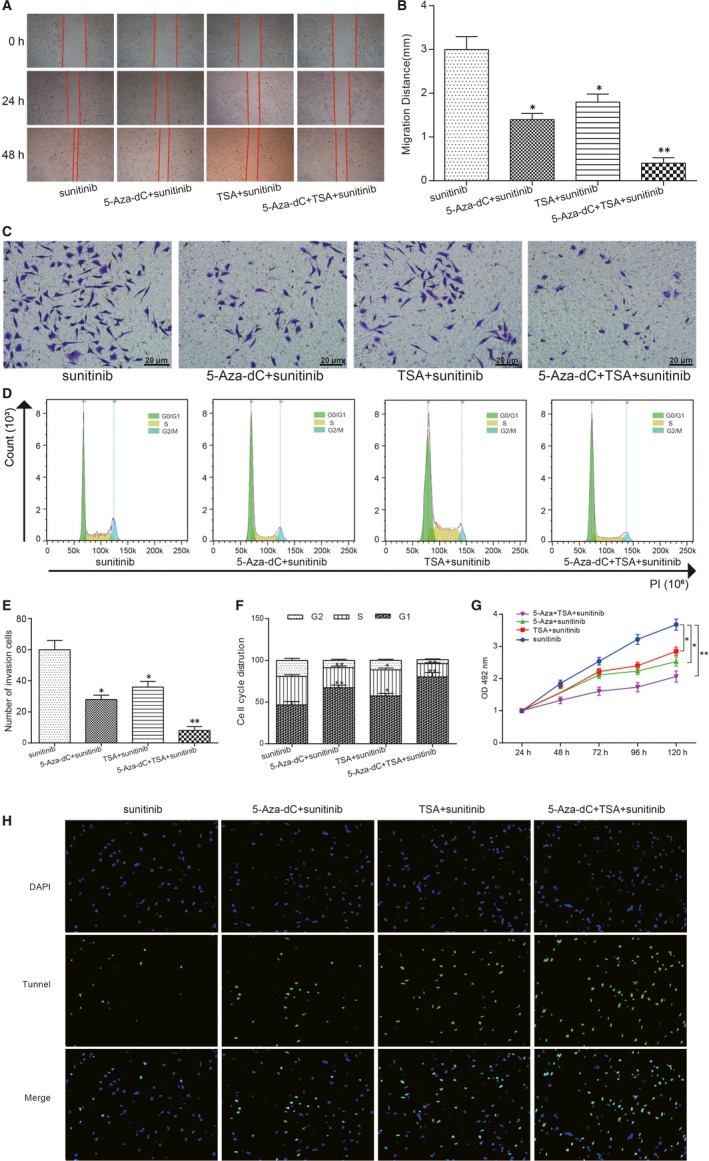
Figure 5.

PON1 inhibited cell migration, invasion and proliferation, and arrested more cell at the G0/G1 phase. A,B, The wound‐healing assay showed that the migration distance of 5‐Aza‐dC treatment and TSA treatment were inhibited and the co‐treatment group displayed more obvious trend. *P < 0.05, ** P < 0.01, compared with the sunitinib group. C&E, The number of invasive cells in 5‐Aza‐dC treatment and TSA treatment were decreased and co‐treatment group displayed more obvious trend. *P < 0.05, ** P < 0.01, compared with the sunitinib group. D&F, More cells were arrested at the G0/G1 phase in 5‐Aza‐dC treatment group and TSA treatment group and co‐treatment group displayed more obvious trend. *P < 0.05, ** P < 0.01, compared with the sunitinib group. G, Cell proliferation was inhibited in 5‐Aza‐dC treatment group and TSA treatment group and co‐treatment group displayed more obvious trend. *P < 0.05, ** P < 0.01, compared with the sunitinib group. H, The apoptosis cells were increased in 5‐Aza‐dC treatment group and TSA treatment group and co‐treatment group displayed more obvious trend (×40)
