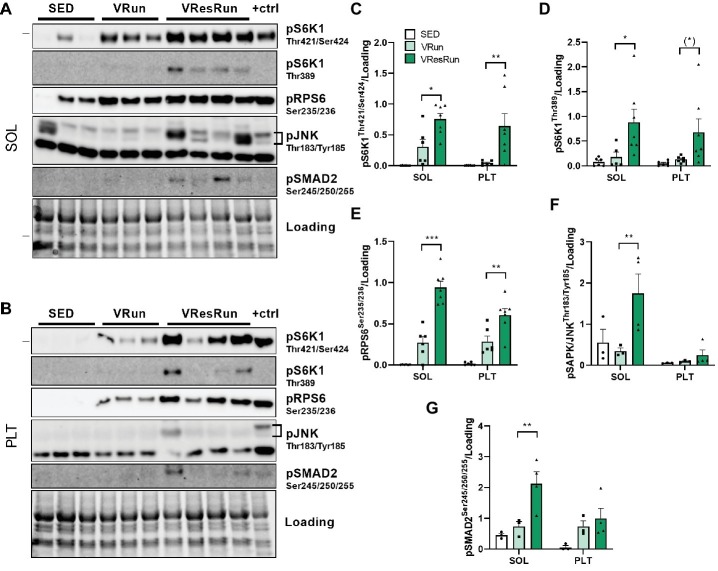
Figure 4.
The effect of 5 h of voluntary running (VRun, n = 6) and voluntary resistance running (VResRun, n = 7) on mTORC1 downstream signaling. (A) Representative blots in SOL. (B) Representative blots in PLT. (C) Quantification of pS6K1Thr421/Ser424. (D) Quantification of pS6K1Thr389. (E) Quantification of pRPS6Ser235/236. (F) Quantification of pSAPK/JNKThr183/Tyr185. (G) Quantification of pSMAD2Ser245/250/255. (Sed, n = 6). *p < 0.05 vs. SED, **p < 0.01 vs. SED, ***p < 0.001 vs. SED.

