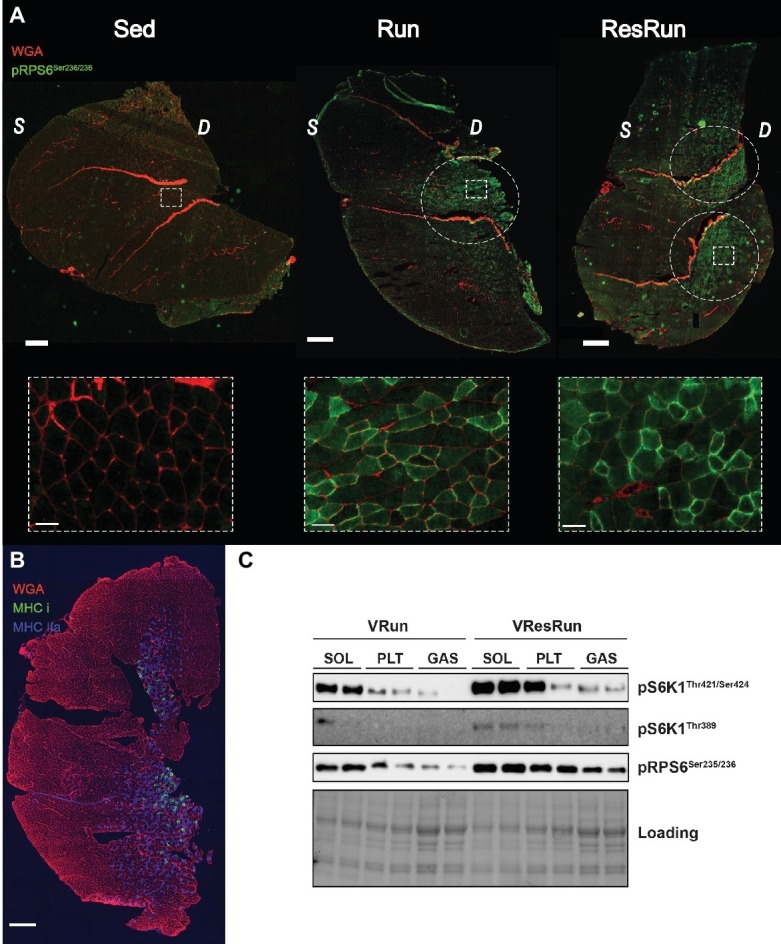
Figure 5.

(A) Representative immunofluorescence pictures of GAS in Sed, VRun, and VResRun with pPRS6Ser235/236 in green and WGA in red. (B) Representative immunofluorescence staining of GAS with Myosin Heavy Chain type I in green, Myosin Heavy Chain type IIa in blue and Wheat Germ Agglutinin WGA in red. (C) Representative blots of downstream mTORC1 signaling (VRun and VResRun) in SOL, PLT, and GAS. Scale bar in tile scan represents 500 μm and scale bar in zoom-in represents 50 μm; WGA, wheat germ agglutinin; S, superficial part; D, deep part.
