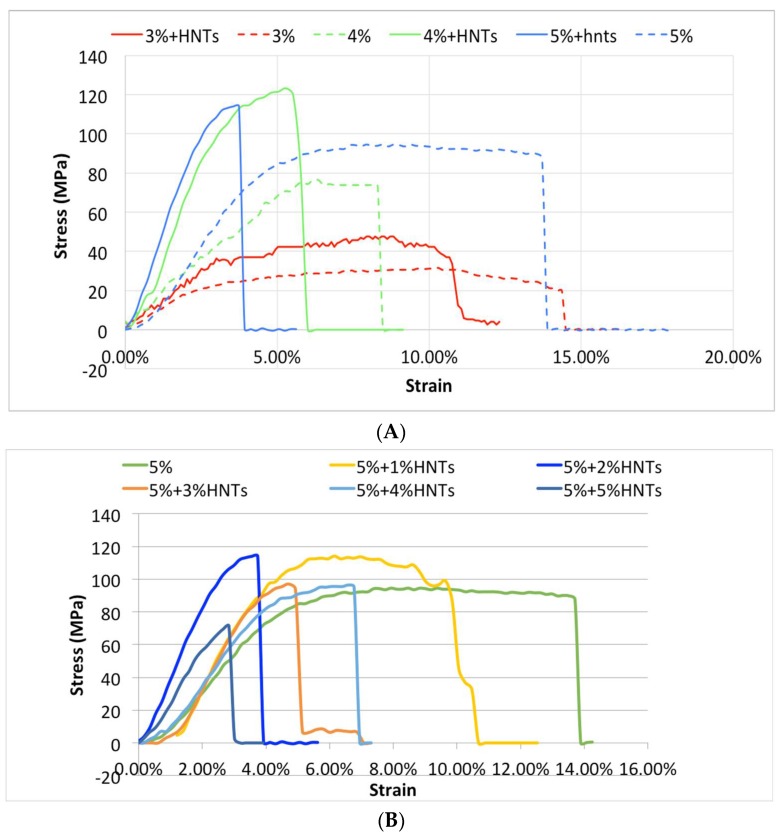
Figure 3.
The stress-strain profile of CS and CS/HNTs. (A) Tensile test of pure chitosan (CS) with the HNT additive groups (CS/HNTs). In this graph, every CS/HNT compound has a higher stress value compare to CS group. (3% CS/2% HNTs > 3% CS, 4% CS/2% HNTs > 4% CS, 5% CS/2% HNTs > 5% CS). Simultaneously, a higher concentration of chitosan showed higher stress values (5% > 4% > 3%), however, the strain values displayed a different response (5% < 4% < 3%). (B) 5% CS/1% HNTs showed a major improvement in elongation, while 5% CS/2% HNTs showed the greatest improvement in strength. Increasing of number of HNTs gradually decreased its reinforcement ability, until at these concentrations (CS/HNTs (5% CS/ 5% HNTs), the nanocomposites was weaker and more fragile than pure CS. The step-wise failure behavior (slippage) at the end of each profile represents the fracture point of each specimen.

