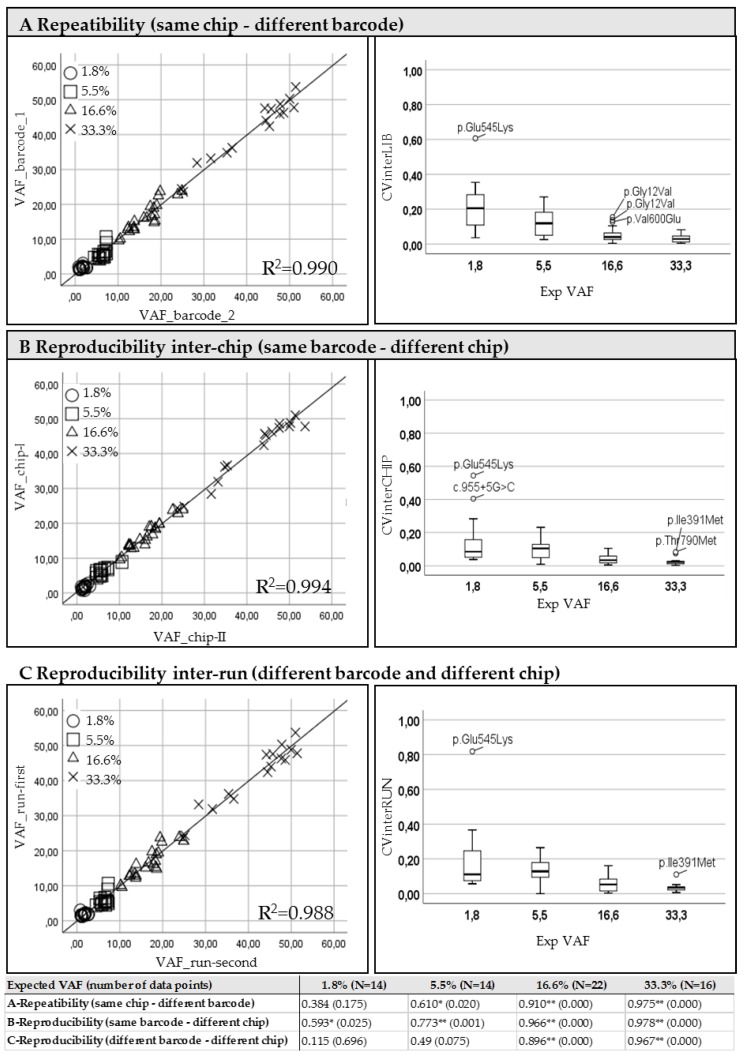
Figure 1.
Repeatibility and Reproducibility of the NGS method. Diluted mixed DNA samples from cell lines were analyzed using different barcodes (A) or on different chips (B) or with different barcodes in two consecutive runs (C). Left panels: Each section reports the correlation between the returned VAFs in the specific evaluation experiment. In the scatter graphs, the Pearson’s correlations are illustrated grouping data using different symbols depending on the expected VAFs. Pearson’s coefficients for each expected VAFs are reported in the table at the bottom of the figure. Significant correlations are flagged with one star (*) or two stars (**) if the p-value is less than 0.05 and 0.001, respectively. Right panels: the box-plots represent the distribution of the coefficients of variation obtained for each experimental condition at different expected VAFs. Outliers are indicated by the specific mutation change.

