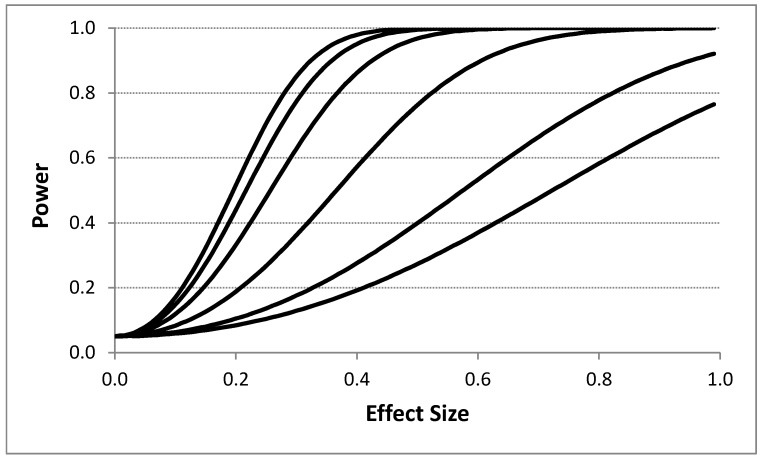
Figure 2.
Influence of the effect size (i.e., difference between intervention responses in standard deviation units) on power assuming four intervention periods and 400 total observations (i.e., 8 intervention administration periods overall with 50 observations; a ‘4p × 2i’ design as described in the text) with no washout periods based on the proposed analytical model. Each line corresponds to a different assumed serial correlation strength. The upper most line represents a 0.0 serial correlation, with successive lines below it reflecting serial correlations of 0.1, 0.25, 0.5, 0.75, and 0.9, respectively. A type I error rate of 0.05 was assumed.

