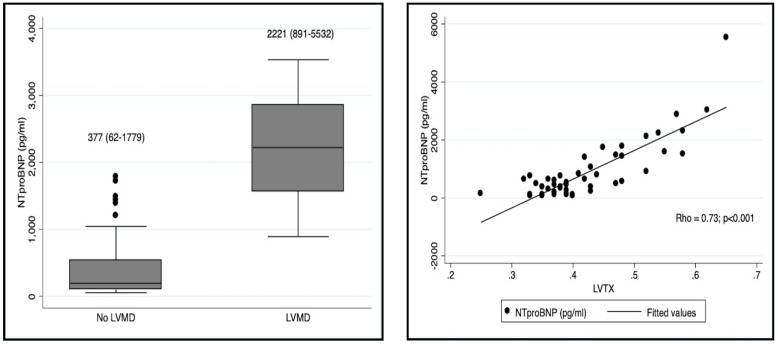
Figure 5.
The left panel is a box-plot diagram representing the comparison of NT-proBNP levels between patients with and without LVMD. The right panel represents the correlation found between LVTX and NT-proBNP levels. LVTX (Left ventricular Tei index); LVMD (Left ventricular myocardial dysfunction).

