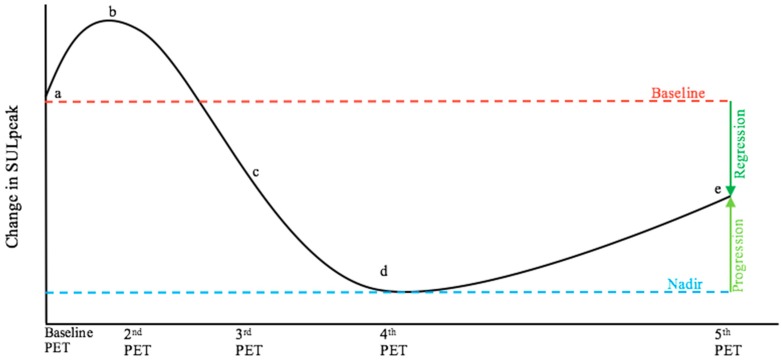
Figure 3.
The graph is a theoretic illustration showing the curve for the continuous variable of SULpeak in a fictive patient that corresponds to the patient course illustrated in Figure 2, where (a) to (e) now represent corresponding fictive SULpeak values. The bone lesion in (e) is considered suspect for metastasis. The patient would be categorized to have partial metabolic regression, when compared to baseline (a) as suggested by PERCIST 1.0, but progressive metabolic disease would be concluded when compared to nadir (d). which may be more clinically relevant. SULpeak= peak standardized uptake value normalized to lean body mass.

