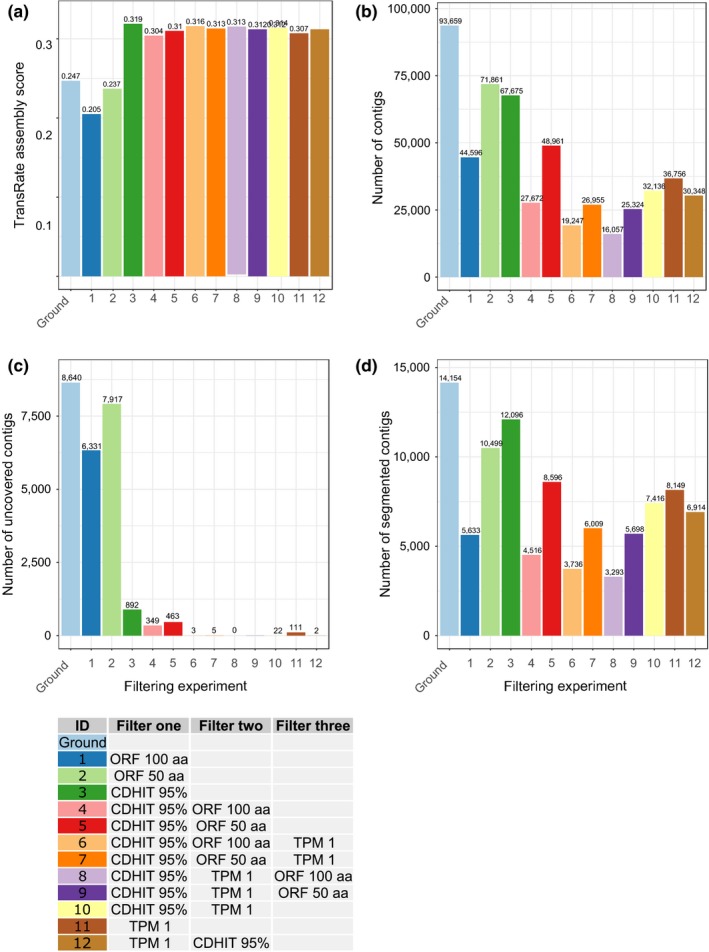
Figure 2.

TransRate statistics for every filtering step to find the optimal filtration method. Every letter corresponds to a filtering experiment. The side‐table indicates the color and letter coding of the filters applied and their order. Ground bars are made by running Transrate‐Q on the unfiltered transcriptome. (a) TransRate assembly scores for each filtering experiment. Higher scores indicate higher quality. (b) Number of transcripts for each filtering experiment (c) Number of transcripts with less than one average per‐base coverage per filtering experiment. (d) Number of segmented (chimeric) contigs, that is, having un‐uniform expression patterns for each filtering experiment
