
Figure 4.
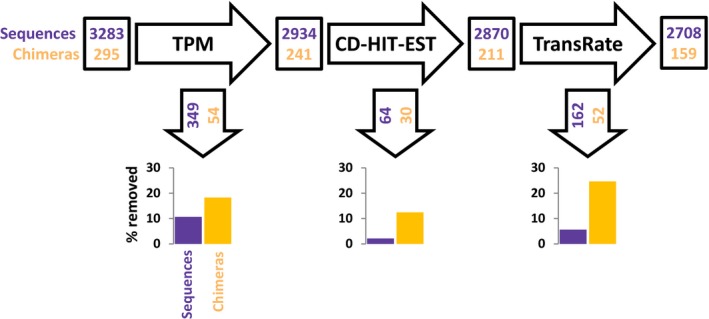
Flowchart of the number of contigs (chimeric or not) during the Drosophila melanogaster simulated RNA‐Seq experiment. Numbers in black boxes are the number of chimeras (orange) and other sequences (violet) left in the assembly at the different stages. The numbers in black arrows refer to the number of chimera or other sequences removed by each filtering step. The bar charts display the percentage of chimera (orange) or other sequences (violet) removed by each filtering step