Figure 2.

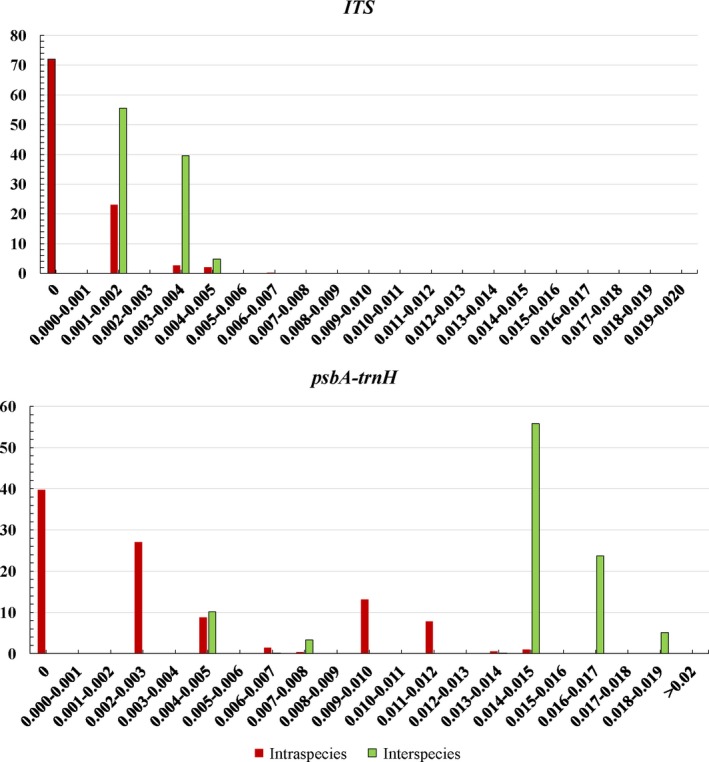
Relative distribution of the interspecific and intraspecific variation using the two barcodes based on the K2P genetic distance

Relative distribution of the interspecific and intraspecific variation using the two barcodes based on the K2P genetic distance