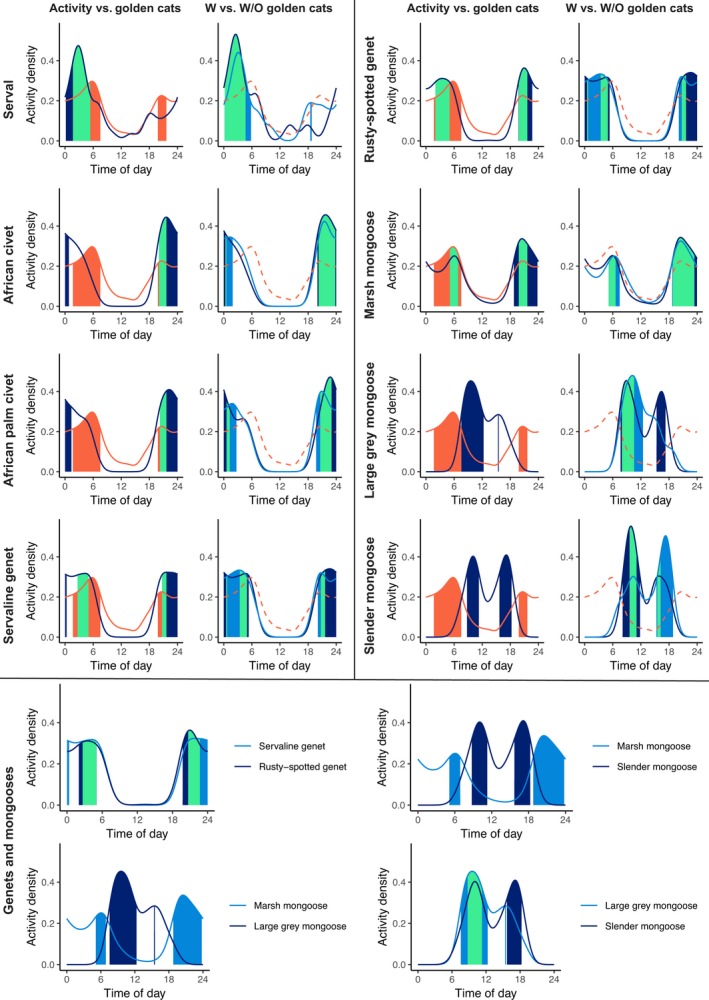
Figure 4.

First and third columns: A comparison of overlap (indicated in green) between 50% core activity patterns of African golden cats (orange) and eight other small carnivore species (dark blue). Second and fourth columns: A comparison of overlap (green) between 50% core activity patterns of eight small carnivore species in the presence of (dark blue) and absence of (light blue) African golden cats. Bottom four plots: Overlap between 50% core activity patterns (green) of related species (genets and mongooses). When no overlap is present, only the respective core activity periods are displayed. All data were collected in Kibale National Park, Uganda, in 2013–2014
