
Figure 3.
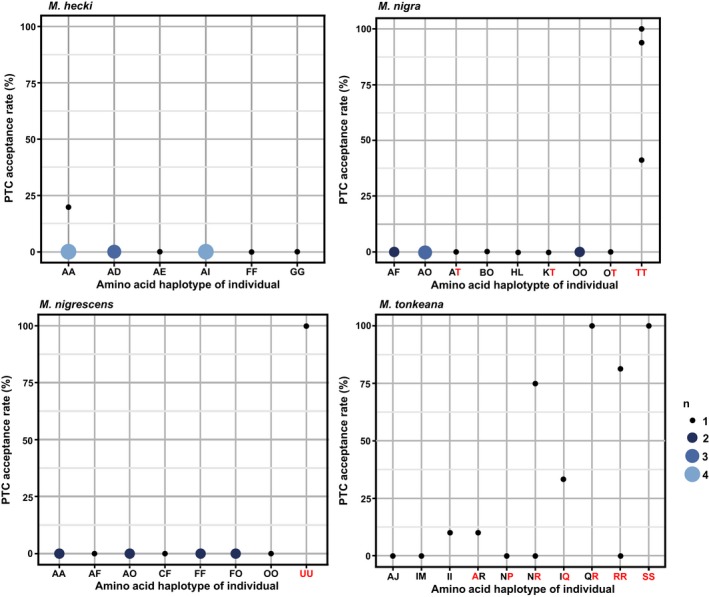
PTC acceptance rate for each amino acid haplotype of individuals of the four species of Sulawesi macaques. The y‐axis shows the PTC acceptance rate (%); the x‐axis shows the amino acid haplotype. Red indicates the PTC‐non‐taster/PTC‐low‐sensitivity haplotype