Figure 4.

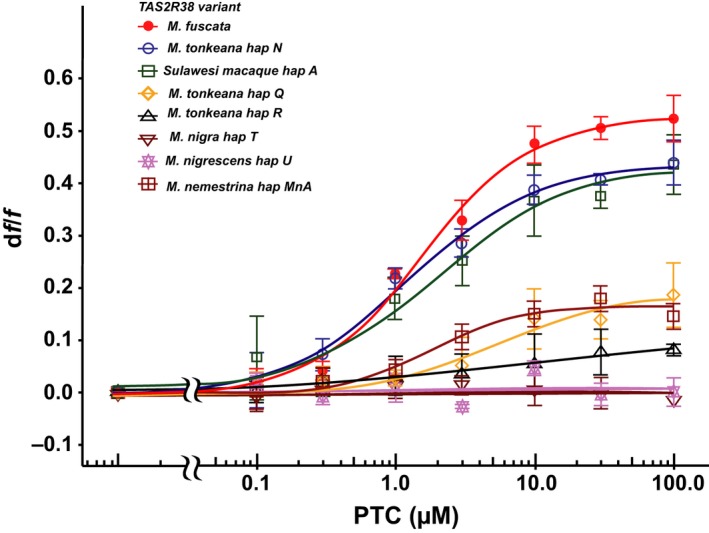
Dose–response curve for TAS2R38s of Sulawesi macaques, M. nemestrina, and M. fuscata against PTC concentrations. Each point represents the mean ± standard error of the mean (SEM) determined from three independent measurements

Dose–response curve for TAS2R38s of Sulawesi macaques, M. nemestrina, and M. fuscata against PTC concentrations. Each point represents the mean ± standard error of the mean (SEM) determined from three independent measurements