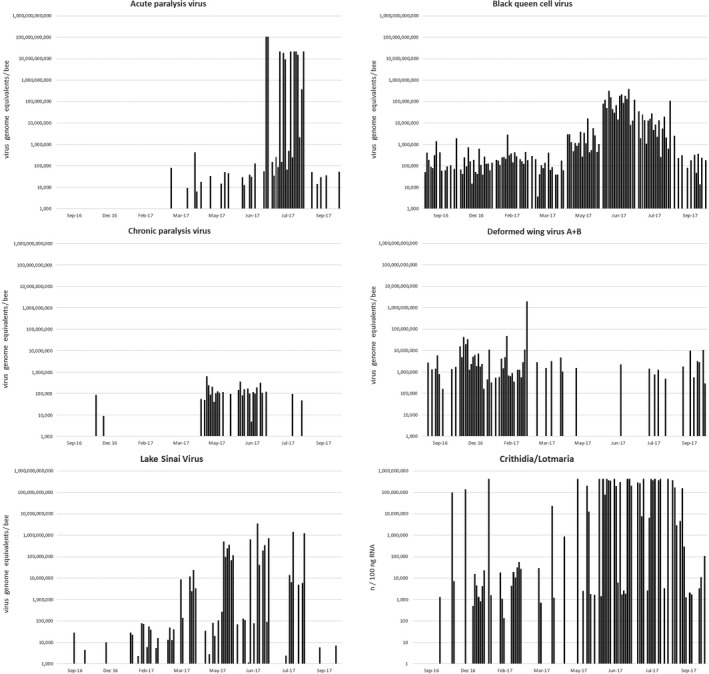
Figure 2.

Seasonal dynamics of selected pathogens in one apiary. Each bar represents a single forager bee, and 18 bees from three colonies within the apiary were analyzed for each time point. Data from the same individuals are shown in all diagrams. The dynamics shown here are a good representation of the trends observed in the other apiaries assessed in this study, except for the paralysis viruses, which were absent or less abundant in most of the other apiaries
