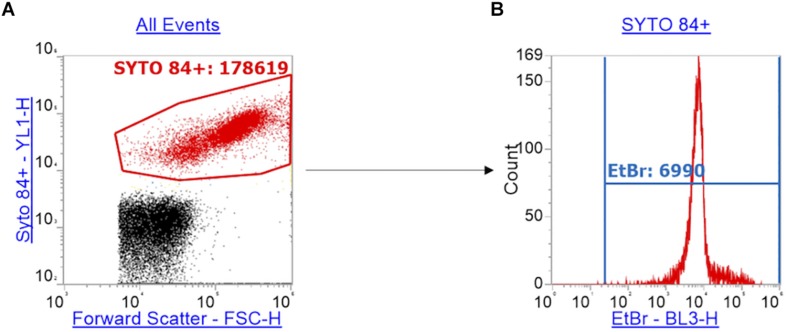
FIGURE 1.
Gating strategy for the measurement of ethidium bromide RFU. Panel (A) shows how cells (red) were separated from background debris (black) by gating SYTOTM 84+ cells (red) using a plot of the orange fluorescence emission channel YL1-H (SYTOTM 84 fluorescence) against forward scatter (FSC-H). (B) Using the red gate of SYTOTM 84+ population, a histogram of ethidium bromide fluorescence per cell was plotted using the emission channel BL3-H. The ethidium bromide gate (blue) gives the x-median of ethidium bromide fluorescence to measure relative accumulation.

