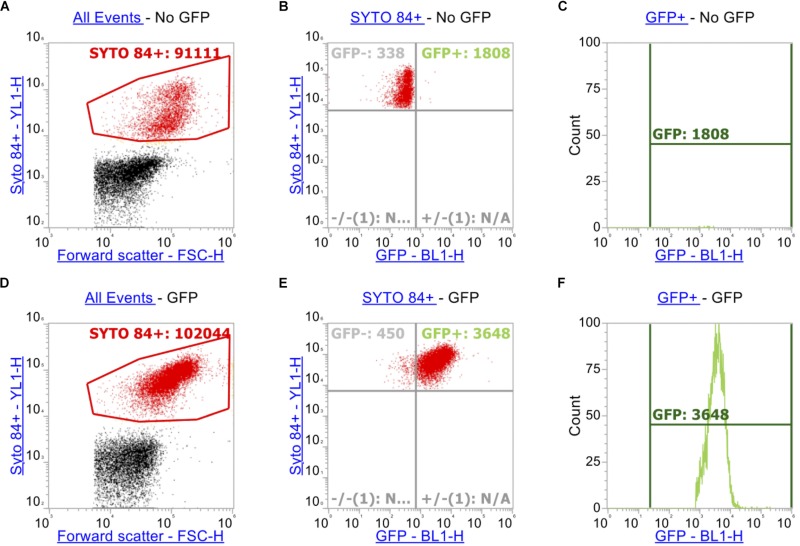
FIGURE 2.
Gating strategy when measuring GFP alongside ethidium bromide. As above, SYTOTM 84+ cells were gated above in red (A,D). Panels (A–C) represents strain SL1344 expressing no GFP. (B,E) Plots YL1-H for SYTOTM 84 against BL1-H for GFP. Only SYTOTM 84+ cells are analyzed in these plots and the GFP+ gate (Blue, right hand side) represents cells that are expressing GFP only and excluding cells fluorescing in BL1-H channel by spillover (C,F).

