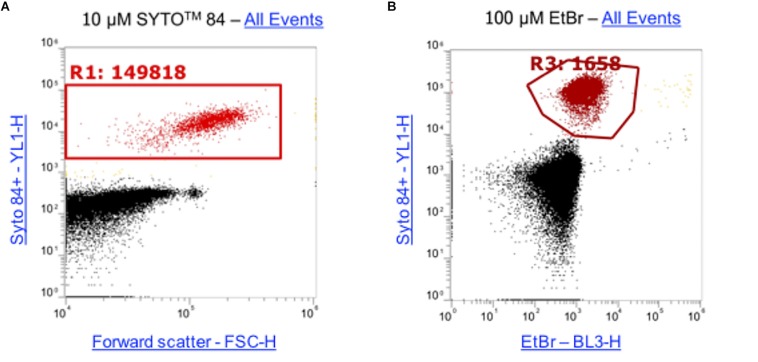
FIGURE 3.
Concentrations of SYTOTM 84 and ethidium bromide used in this assay. (A) 10 μM SYTOTM 84 was used and a population gated (R1) on a orange fluorescence (YL1-H) versus forward scatter (FSC-H) dot plot to identify SYTOTM 84 fluorescence. The concentration was used as it gave the best separation of cells (red) from background cell debris and other particulate noise (black). (B) 100 μM was the optimum concentration of ethidium bromide used as shown via a dot plot of YL1-H (SYTOTM 84) vs BL3-H (ethidium bromide). Both plots show all events.

