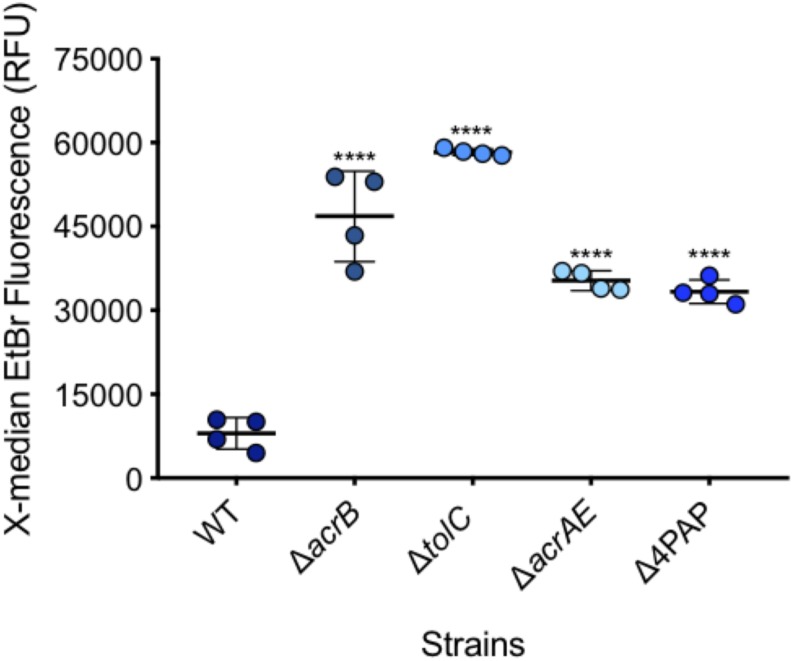
FIGURE 5.
Accumulation of ethidium bromide in WT SL1344 and efflux deficient strains. Single circles represent the X-median value of ethidium bromide fluorescence from 10,000 cells within a biological replicate. 4 biological replicates for each strain are shown, with a long bar to show the mean and standard error of the mean (SEM) error bars. WT had a mean RFU of 8024. This is significantly lower than the mean RFUs of ΔacrB (46824 RFU), ΔtolC (58321 RFU), ΔacrAE (35314 RFU) and D4PAP (33359 RFU). Significance values were based on a one-way ANOVA and Dunnett’s multiple comparison test of all strains compared to WT. All P-values were < 0.0001 which is represented by **** above strain plots in this figure.

