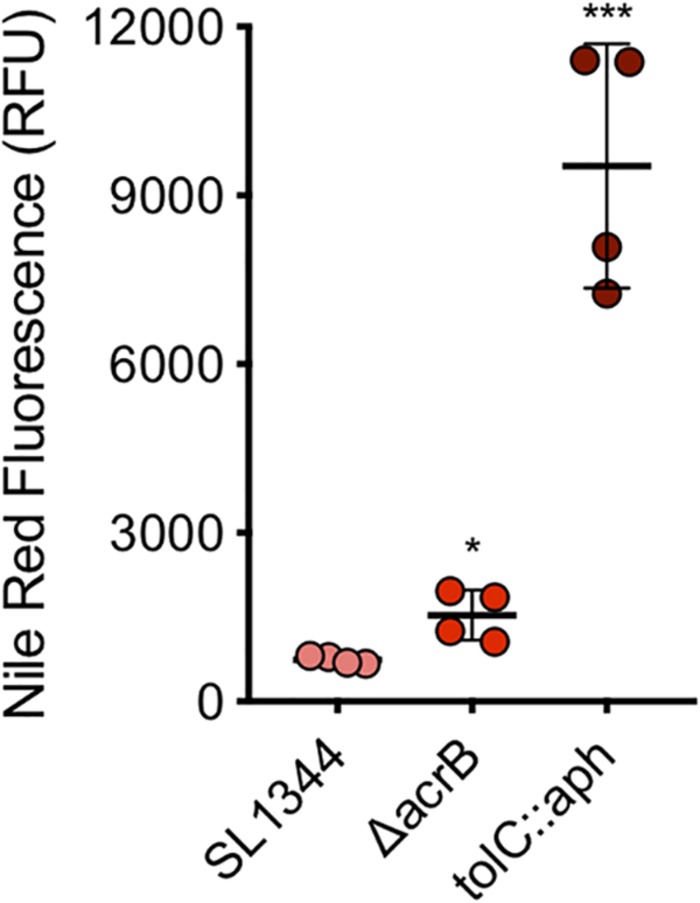
FIGURE 6.
Accumulation of nile red in WT, ΔacrB and tolC::aph in S. Typhimurium. Single circles represent the X-median value of nile red fluorescence from 10,000 cells within a biological replicate using WT (pink), ΔacrB (red) and ΔtolC (dark red). 4 biological replicates for each strain are shown, with a long bar to show the mean and SEM error bars. Significance values were based on an unpaired T-test comparing the efflux deficient strain to WT. ∗ and ∗∗∗ correspond to P-values shown in Supplementary Table S3.

