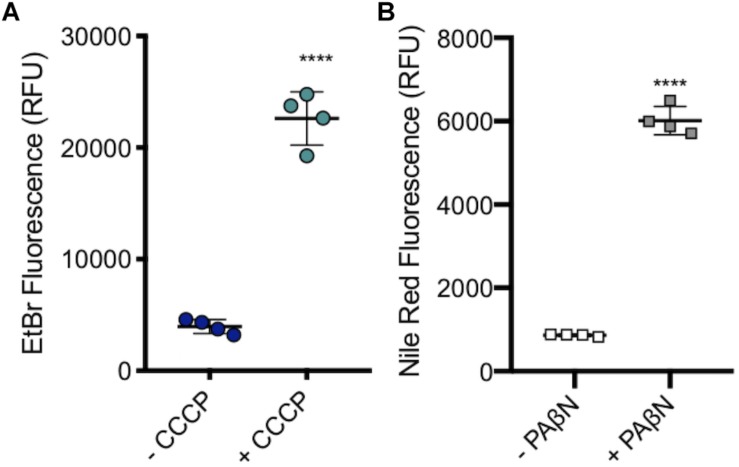
FIGURE 7.
Accumulation of ethidium bromide in SL1344 in the absence and presence of 100 μM CCCP and 50 μg/ml of PAβN. (A) Single dots represent the X-median value of ethidium bromide fluorescence from 10,000 cells within a biological replicate. 4 biological replicates for each condition are shown, with a long bar to show the mean and standard error of the mean (SEM) error bars. WT had a mean RFU of 3936 (blue); +CCCP (green) the RFU increased sixfold to 22596 RFU. (B) Single squares represent the X-median value of nile red fluorescence in the presence and absence of PAβN, from 10,000 cells within a biological replicate. 4 biological replicates for each condition are shown, with a long bar to show the mean and SEM error bars. WT had a mean RFU of 863 (white); + PaβN (gray) RFU showed a sevenfold increase. For both (A) and (B) Significance values were based on an unpaired T-test. The P-values were < 0.0001 which was represented by **** in this figure.

