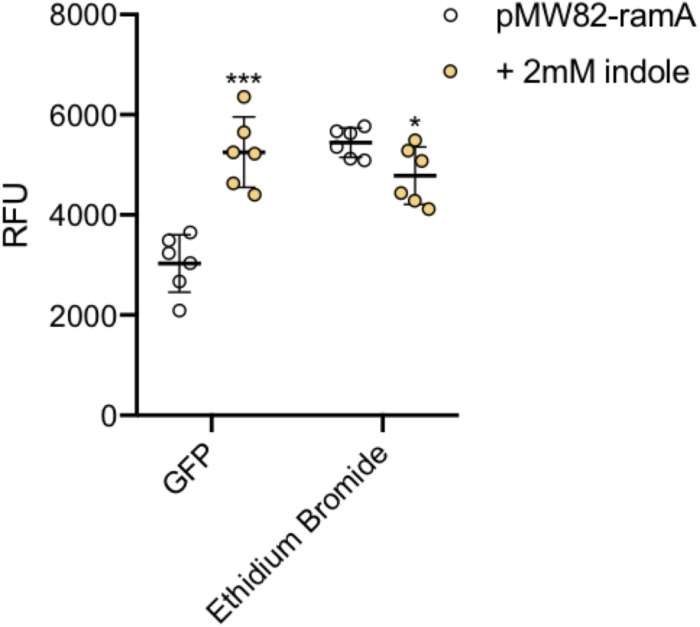
FIGURE 8.
Accumulation of ethidium bromide and fluorescence of GFP. The ethidium bromide and GFP fluorescence (x-axis) were measured in SL1344 pMW82-ramA in the absence (white) and presence (orange) of 2 mM indole. 6 biological replicates for each strain are shown, with a long bar to show the mean and standard error of the mean (SEM) error bars. Ethidium bromide fluorescence of the strains is shown and is consistent with results above. The X-median RFU for GFP is shown without (white) and with (orange) the addition of indole in strains containing a pMW82-ramA transcriptional reporter. Without indole, the mean RFU is 2963 but with indole it is 5230 RFU. Unpaired T-tests were run to compare fluorescence of GFP and ethidium bromide with and without indole. The P-value for GFP (∗∗∗) was 0.0001; The P-value for EtBr (∗) was 0.0315.

