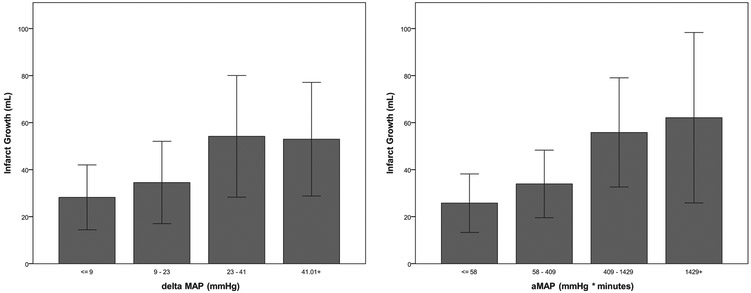
Figure 3: Association of blood pressure reduction with infarct growth.
∆MAP (left) and aMAP (right) were divided into equal quartiles and plotted against infarct growth. Bar graphs represent mean for each quartile of blood pressure reduction and relative hypotension; error bars indicate the 95% confidence interval.

