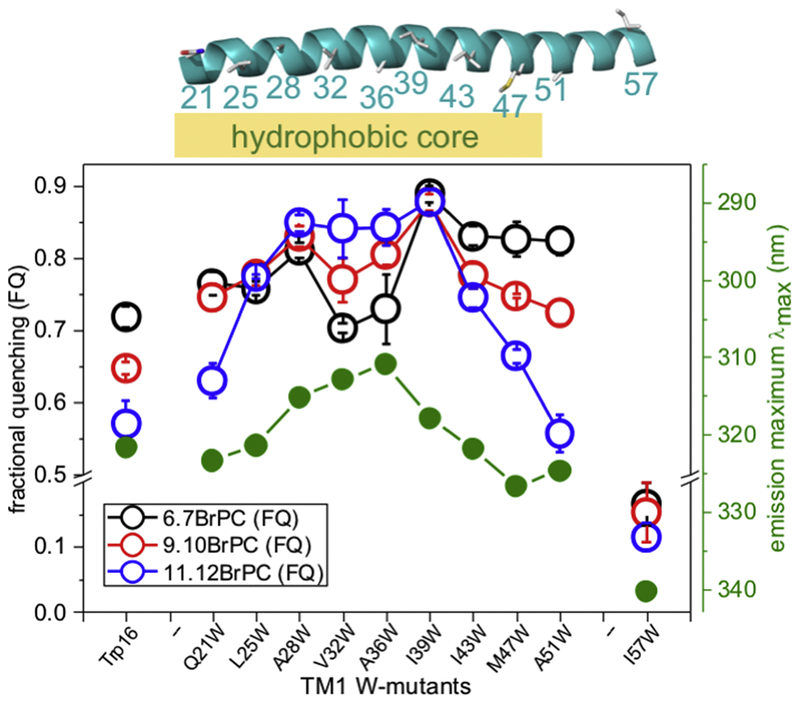
Figure 2: Association of the membrane bilayer to TM1.
Fractional quenching for W-mutants on TM1 are shown for reconstitutions with lipids brominated at different positions along the fatty acid chains (key: black, 6.7BrPC; red, 9.10BrPC; blue, 11.12BrPC). Emission maxima for the individual mutants are shown in green. The centre of the membrane is approximately at residues A34-L35. The structure of TM1 from the MscS structure D67C (PDB: 5AJI) is shown on top indicating the hydrophobic core region of the membrane (orange). Data for Trp16 are shown on the left.

