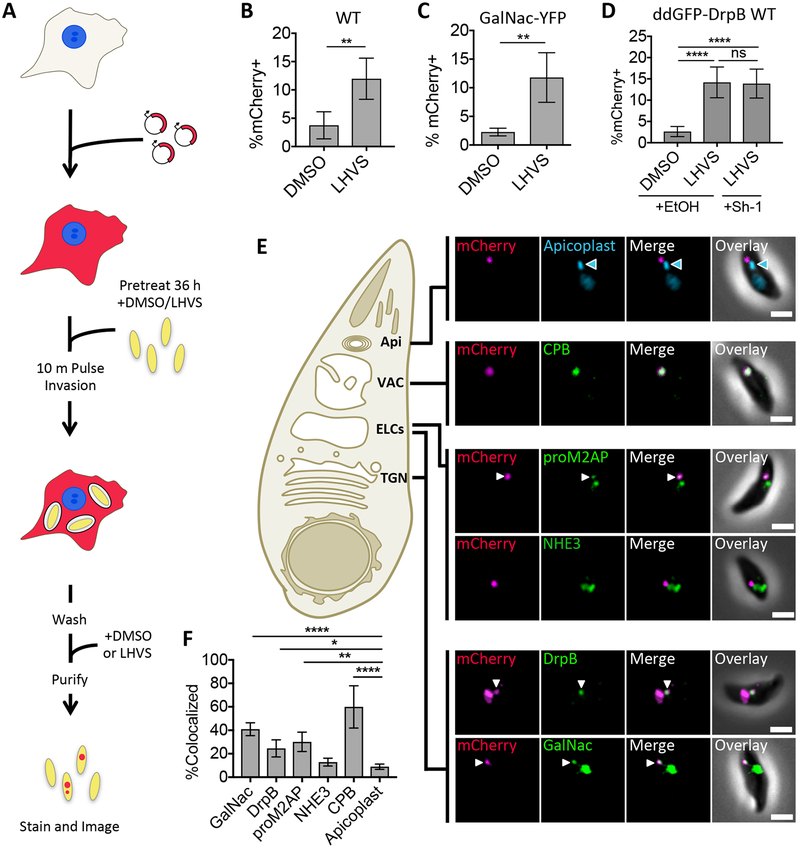
FIGURE 1.
Ingested host cytosolic mCherry is associated with the ELCs, VAC, and possibly the TGN. A, Experimental design for detection and localization of host cytosolic protein ingestion. CHO-K1 cells were transiently transfected with a plasmid encoding cytosolic mCherry fluorescent protein 18–24 h before synchronous invasion for 10 min with T. gondii parasites (pretreated with 1μM LHVS or the vehicle control DMSO for 36 h). Parasites were allowed to ingest host cytosol for 3 h in the presence of 1 μM LHVS or DMSO before being purified, stained and analyzed by fluorescence microscopy. B-D, Quantitation of ingestion of host cytosolic mCherry in WT, GalNac-YFP or ddGFP-DrpB WT parasites treated with 1 μM LHVS or DMSO. ddGFP-DrpB WT parasites were also treated with ethanol (EtOH) or 0.8μM Sh-1 for 30 min beginning at 2.5 h post-invasion to induce expression of DrpB WT. Shown is percentage of mCherry positive parasites, at least 200 parasites analyzed per condition, ratio paired t-test for B and C, one-way ANOVA with Tukey’s multiple comparisons for D. E, Representative images for localization of ingested mCherry in LHVS-treated parasites from B-D relative to the apicoplast using DAPI staining, CPB, NHE3 or proM2AP using antibody staining, GalNac-YFP or GFP-DrpB WT. Scale bars: 2μm. Blue arrowhead indicates the apicoplast, and white arrows indicate areas of colocalization when the endolysosomal marker of interest has several puncta. F, Quantitation of colocalization of ingested mCherry with the indicated markers of the endolysosomal system. At least 30 ingested mCherry puncta per marker, one-way ANOVA with Dunnet’s test for multiple comparisons to colocalization with the apicoplast. Only significant associations shown, Apicoplast vs. NHE3 is not significant. All bars represent mean from 3 or more biological replicates with standard deviation error bars. * p<0.05, ** p,<0.01, ***p<0.001, ****p<0.0001, ns is not significant.

