FIGURE 3.
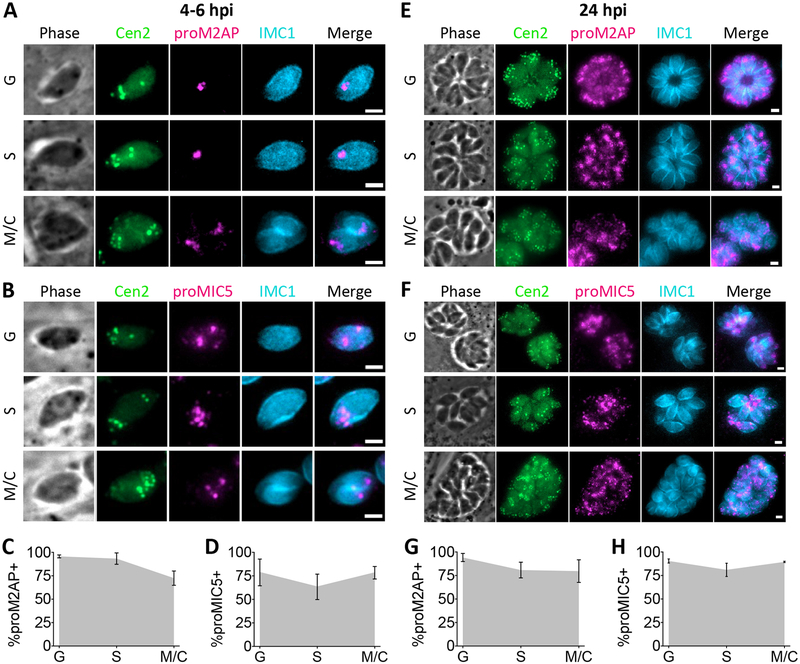
Microneme proteins are expressed in G, S and M/C phase. A and B, Representative images for detection of proM2AP or proMIC5 by immunofluorescent staining in G, S and M/C phase Cen2-EGFP vacuoles stained for IMC1 at 4 to 6 h post-invasion. C and D, Quantitation of percentage of Cen2-EGFP vacuoles positive for proM2AP or proMIC5 staining in G, S and M/C phase at 4 to 6 h post-invasion. E and F, Representative images for detection of proM2AP or proMIC5 by immunofluorescent staining in G, S and M/C phase Cen2-EGFP vacuoles stained for IMC1 at 24 h post-invasion. G and H, Quantitation of percentage of Cen2-EGFP vacuoles positive for proM2AP or proMIC5 staining in G, S and M/C phase at 24 h post-invasion. Error bars in all graphs represent standard deviation, and the point where the grey fill intersects the error bars represents the mean. Values derived from 3 biological replicates each with at least 100 total vacuoles and at least 30 vacuoles per cell cycle phase analyzed. Scale bars: 2 μm.

