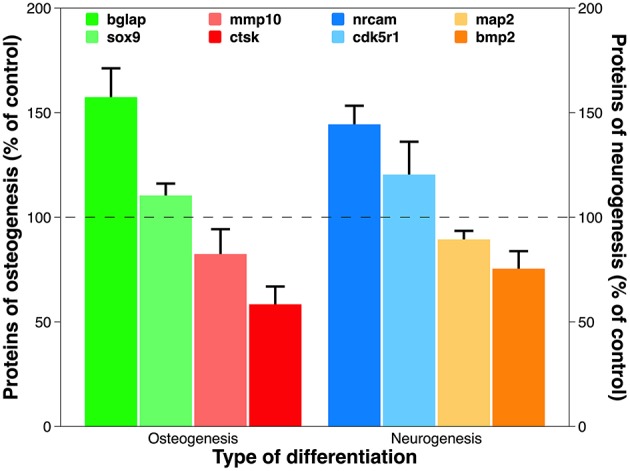
Figure 9.

Expression of proteins translated from representative deregulated genes discovered in PCR array analysis for osteogenesis and neurogenesis. Using the optical absorbance at 450 nm during ELISA, the data are presented as percentage of control. Statistical annotation is omitted because the difference between test group and control is statistically significant for each protein tested.
