Figure 2.
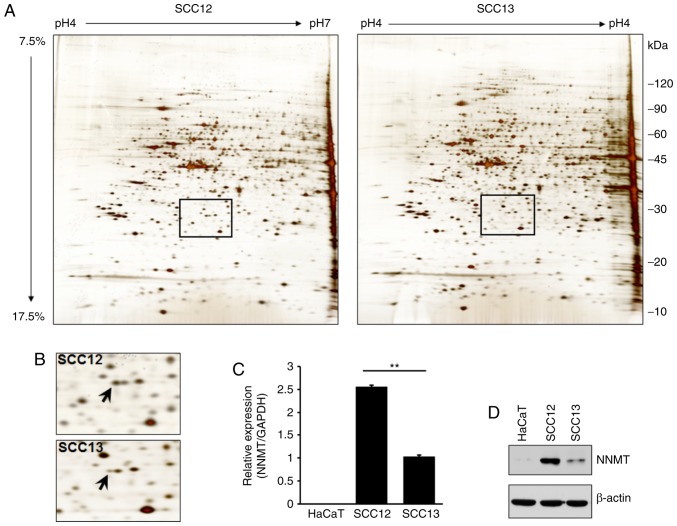
Proteomics analysis of SCC cell lines. (A) Representative 2-DE maps of SCC12 and SCC13 cell proteins. Total proteins (50 µg) extracted from SCC12 and SCC13 cells were analyzed using a two-dimensional gel (focusing at pH 4.0–7.0, followed by 7.5–17.5% SDS-PAGE) and stained with silver nitrate. (B) Magnified images of the area shown in the rectangular box in (A) NNMT protein (indicated by an arrow) was upregulated in SCC12, compared with SCC13 cells. (C) Expression levels of NNMT in cutaneous SCC cells and HaCaT cells (an epidermal keratinocyte-derived non-tumorigenic cell line) were analyzed by RT-qPCR. GAPDH was used as the control. **P<0.01. (D) The NNMT protein expression level in the HaCaT, SCC12 and SCC13 cell lines was determined by western blot analysis using anti-NNMT antibodies. β-actin was used as the control for protein loading. SCC, squamous cell carcinoma; 2-DE, two-dimensional gel electrophoresis; NNMT, nicotinamide N-methyltransferase.

