Figure 9.
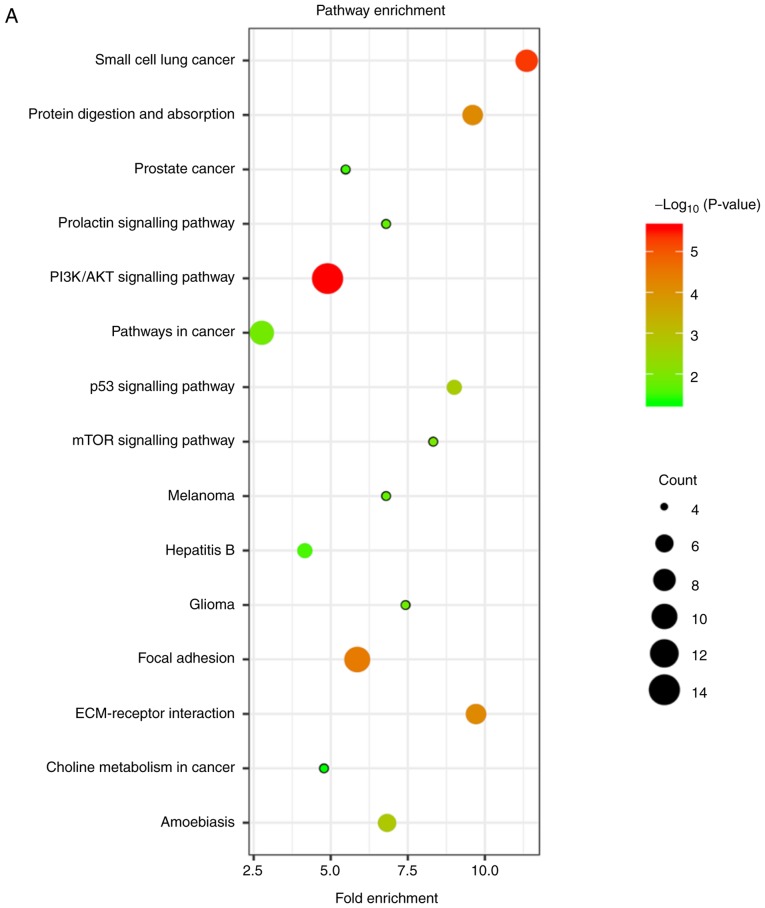
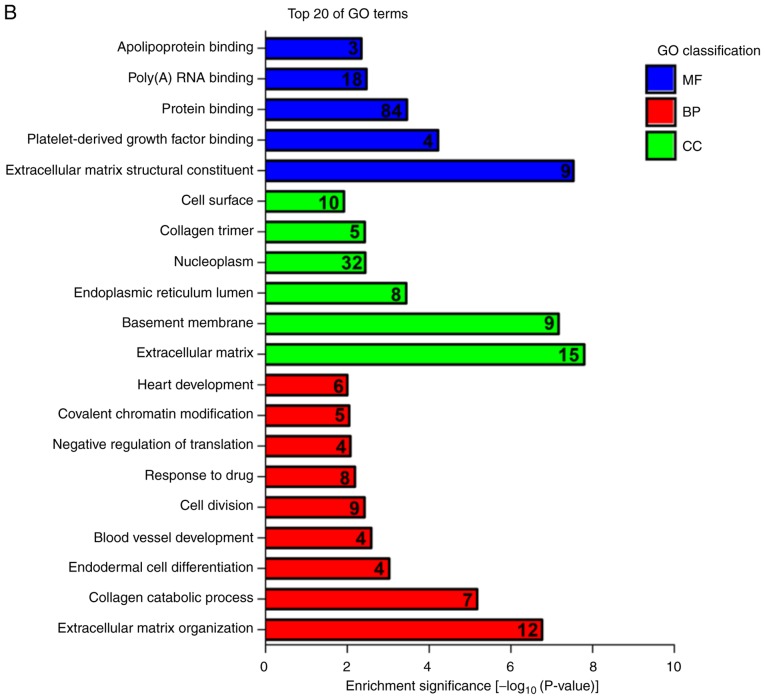
The potential mechanism of four hub miRNAs impacting patient survival. (A) The main pathways of the screened 127 mRNAs. The size of the dot reveals the target gene number in the pathway, and the colour of the dot represents the different P-value range. The x-axis reveals the fold enrichment of genes located in the pathway, and the y-axis exhibits significantly enriched pathways, P<0.05. The -log10 (P-value) of each term is coloured according to the legend on the right. (B) The top 20 GO terms of the selected 127 genes. Likewise, the x-axis reveals the fold enrichment significance of genes, and the y-axis reveals the GO terms. GO, Gene Ontology; BP, biological process; CC, cellular component; MF, molecular function.


