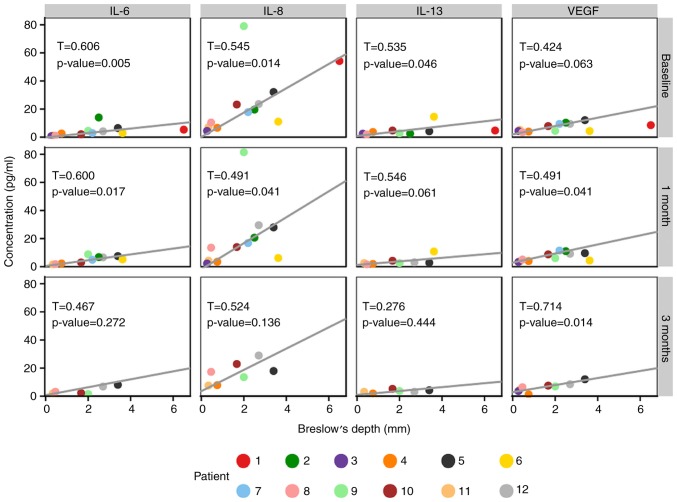
Figure 2.
Correlation of Breslow values with serum levels of selected proteins. Scatterplots of values for individual MM patient at each sample collection point are presented. The lines represent the Theil-Sen estimator of a linear relationship. The non-parametric Kendall's tau correlation coefficient together with the corresponding P-value is displayed in each plot panel. IL, interleukin; VEGF, vascular endothelial growth factor.

