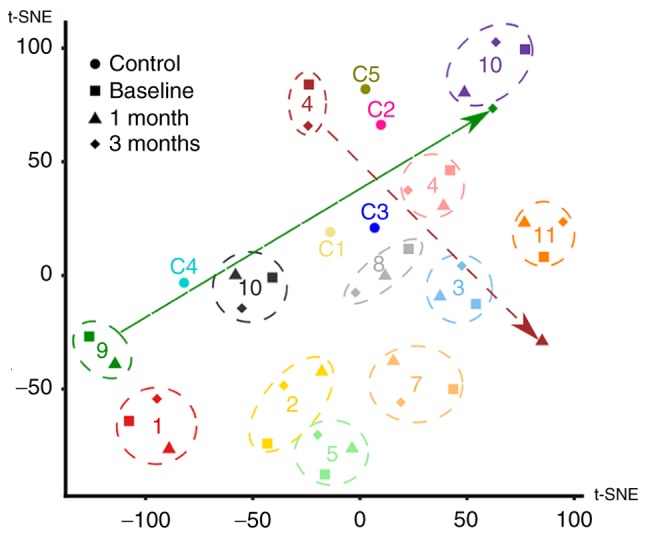
Figure 4.

Cluster analysis of patients with MM. The high-dimensional dataset of 28 proteins measured for each patient was mapped onto a two-dimensional space using t-SNE. One data point for each of the controls (circles) and one data point for each patient/time-point combination (baseline, square; 1 month, triangle; 3 months, diamond) were plotted. Numbers (corresponding to Tables I and SII) were used to label the individual controls and patients. The overall variability of the dataset appeared to be mostly driven by individual differences between subjects, as data from different time points of the same patient generally clustered together (highlighted by the dashed circles). However, for a few patients, there were outlier data points (highlighted by arrows). tSNE, t-distributed stochastic neighbour embedding.
