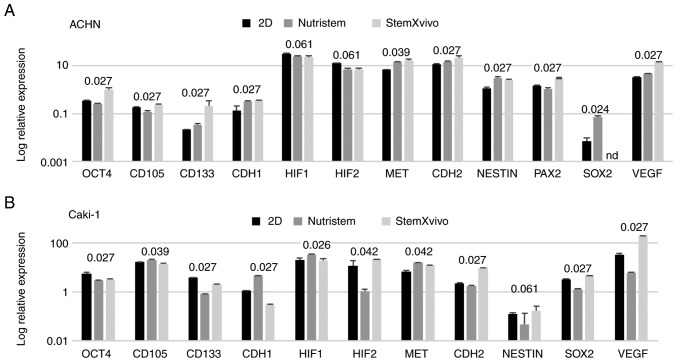
Figure 3.
Effect of 3D structure formation on gene expression (log relative expression) as determined using real-time PCR in (A) ACHN cells cultured on poly-D-lysine-coated surface in 3D media and standard monolayer or (B) Caki-1 cells cultured on laminin-coated surface in 3D media and standard monolayer. P-values using the Kruskal-Wallis test are presented over the graphs for each gene. P-values <0.05 are in bold print; n=2 wells. OCT4 or POU5F1, POU class 5 homeobox 1; CD105 or ENG, endoglin; CD133 or PROM1, prominin 1; CDH1, cadherin 1; HIF1, hypoxia-inducible factor 1-alpha; HIF2, hypoxia-inducible factor 2-alpha; MET, MET proto-oncogene, receptor tyrosine kinase; CDH2, cadherin 2; NESTIN, nestin; PAX2, paired box 2; SOX2, SRY-box 2; VEGF, vascular endothelial growth factor.

