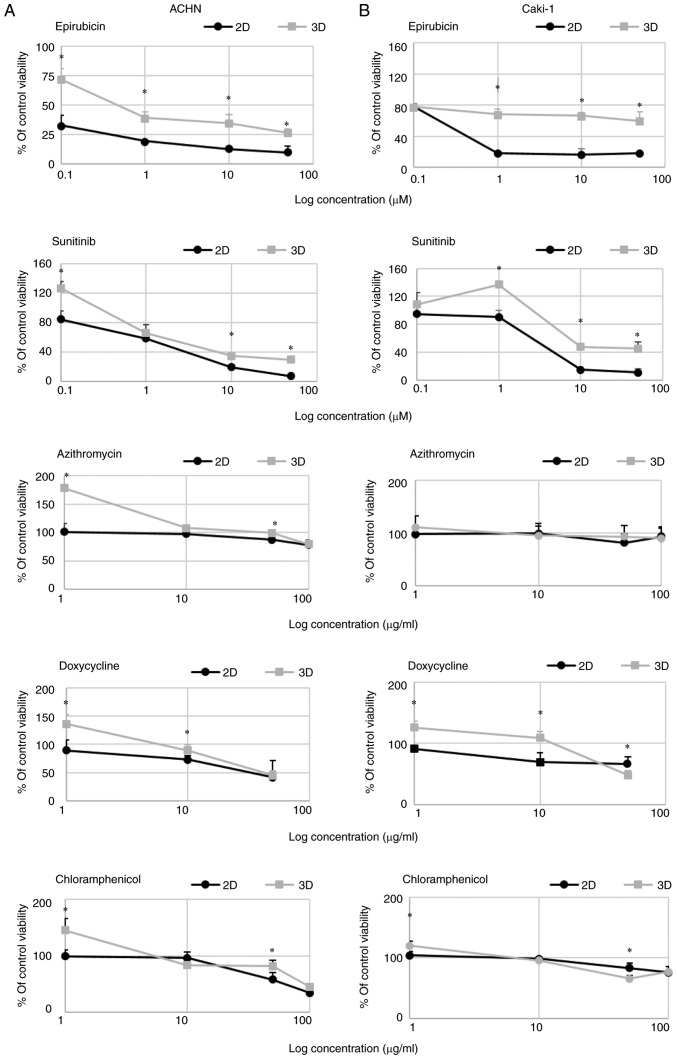
Figure 4.
Dose-dependent changes in (A) ACHN and (B) Caki-1 cell viability (presented as % of control, untreated cells) in response to drug addition to 2D- (RPMI/FBS) or 3D-cultured cells (StemXvivo) as determined by Alamar Blue reduction. x-axis represents the log concentration of each tested drug. *P<0.05, 2D vs. 3D; using the Mann-Whitney U test; n=3 wells.

