
Fig. 1.
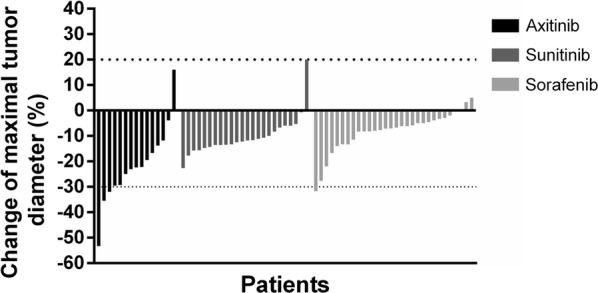
Waterfall plot of the change of maximal tumor diameter at 12 weeks after neoadjuvant therapy initiation. Each bar represents the datum of 1 individual patient. Negative values represent diameter reduction, and positive values represent diameter increment. A change greater than − 30% indicates partial response, − 30% to 20% indicates stable disease, and greater than 20% indicates progressive disease