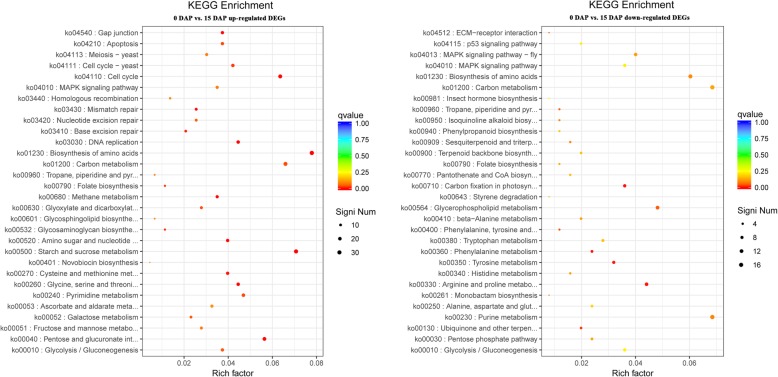
Fig. 3.
KEGG enriched scatter plots of up-regulated (left) and down-regulated (right) DEGs in the 0 DAP vs. 15 DAP comparison. Rich factor refers to the ratio of the number of DEGs enriched in the pathway to the number of annotated genes. The larger the Rich factor, the more significant the enrichment is. The q-value is the corrected P-value after multiple hypothesis testing, which ranges from 0 to 1. The closer to zero, the more significant the enrichment is

